
Stock Market Performance: Indexes Extend Gains from April Lows, but Participation Remains Uneven
US and European stock futures are little changed today, as worldwide markets process a combination of defensive corporate news and political unease. Dow Jones Industrial Average futures are up just 7 points, or a meager 0.02%, as S&P 500 futures are up by just 0.04%, and Nasdaq 100 futures by 0.07%, as a lack of conviction ensues following the S&P 500 breaking a seven-day winning streak
Stock Market Performance
Indexes Extend Gains from April Lows, but Participation Remains Uneven
U.S. equity benchmarks have maintained upward momentum since the April 8th trough, yet structural volatility and uneven participation persist beneath the surface. Despite strong year-to-date advances, the depth of drawdowns across individual constituents reveals that the broader market recovery remains fragile and concentrated in select leaders. Traders interpret these dynamics as signaling optimism tempered by caution—a market still balancing growth enthusiasm with valuation fatigue.
S&P 500: Stable Leadership, Narrow Breadth
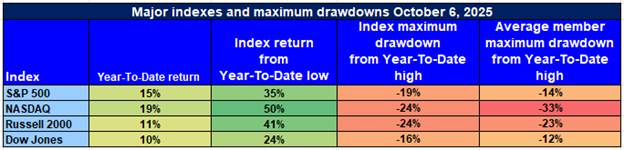
YTD: +15% | +35% off April low | -19% from YTD high | Avg. member: -14% (from April low) / -26% (from high)
The S&P 500 continues to reflect headline strength, advancing 15% year-to-date and climbing 35% since its April low. However, a 19% drawdown from the year’s high and the average member’s 26% decline from peak levels underscore that leadership remains narrowly concentrated among megacaps. Broader participation is still lacking, suggesting the rally is driven by balance sheet quality and large-cap defensives rather than widespread sector recovery.
NASDAQ: Growth Momentum Faces Deep Underlying Strain
YTD: +19% | +50% off April low | -24% from YTD high | Avg. member: -33% (from April low) / -48% (from high)
The NASDAQ 100, also known as US 100 Index CFD index, has outpaced peers with a 19% YTD gain and a 50% rebound from April levels, highlighting resilience in the tech-growth complex. Yet a severe 24% drawdown from highs and steep average member losses emphasize internal fragility. Market leadership remains confined to a handful of high-multiple names, while much of the index still trades deep below prior peaks.
Russell 2000: Small-Cap Recovery Struggles for Traction
YTD: +11% | +41% off April low | -24% from YTD high | Avg. member: -23% (from April low) / -38% (from high)
The Russell 2000 shows modest year-to-date improvement at +11%, aided by a strong 41% rebound from April lows. However, persistent 24% drawdowns and wide member losses highlight ongoing pressure in small-cap and regional segments. Weak liquidity, higher debt costs, and inconsistent earnings visibility continue to restrain sustained small-cap participation.
Dow Jones: Defensive Tilt Shields Against Deeper Drawdowns
YTD: +10% | +24% off April low | -16% from YTD high | Avg. member: -12% (from April low) / -23% (from high)
The Dow Jones’ value and industrial composition has offered relative stability, posting a 10% YTD gain and limited 16% drawdown from highs. Average member losses remain contained compared to growth indices, reaffirming the index’s defensive profile amid cyclical uncertainty.
Traders continue to favor high-quality, cash-generative equities with durable earnings momentum and prudent leverage. Broader participation across mid- and small-cap segments will be essential to validate this rally’s durability and confirm that market strength extends beyond index-level resilience.